- Overview of Tableau and Adobe Analytics
- Tableau
- Adobe Analytics
- Tableau Vs. Adobe Analytics: Which is Better?
- Data Integration and Management
- Visualization Capabilities
- Get a custom Tableau dashboard for your Magento store
- Real-Time Analytics and Reporting
- Key Limitations of Adobe Analytics
- Advantages of Tableau for Comprehensive Business Insights
- Superior Data Visualization
- Integration Capabilities
- User-Friendly Interface
- Scalability and Performance
- Simplify data-driven decision-making.
- Real-World Use Cases of Tableau for Magento Stores
- Sales Insights
- Customer Analysis
- Inventory Management
- Financial Reporting
- Operational Efficiency
- Increase customer retention and reduce operational inefficiency with Tableau data visualisation.
- Conclusion
Cloud BI is viewed as crucial by 54% of businesses. But bad data means bad decisions. A good BI tool, such as Tableau, increases ROI by 127% in three years. Today, data visualization tools and analytics tools have entirely altered the way organizations look at the transformation of unstructured data into structured and strategic moves.
“Without big data analytics, companies are blind and deaf, wandering out onto the web like deer on a freeway.” – Geoffrey Moore
The most popular ones include Tableau and Adobe Analytics, which are both important in understanding customers, resource optimization, and cost management. This post compares them, highlighting why Tableau is often the better choice, especially for Ecommerce platforms like Magento.
Overview of Tableau and Adobe Analytics
Tableau
Founded in 2003 at Stanford University, Tableau aims to revolutionize data analytics using its own VizQL technology. Revenue from Tableau services amounted to US $896.1 million in 2021. The total revenue from the tableau services market is expected to attain a value of US $2,183.2 million by the end of 2028, expanding at a CAGR of 13.6 percent from 2022 to 2028.
Today, the company has become part of the business intelligence (BI) industry and comes with the following key features:
- Consistent integration of data.
- Interactive dashboards for dynamic data exploration.
- Real-time analytics.
- Geospatial analysis for location-specific insights.
- Hyper SQL engine for lightning-fast performance.
- Data stories that translate numbers into narratives.
Adobe Analytics
Before its acquisition by Adobe in 2009, Adobe Analytics was initially known as Omniture. Now, it is part of the Adobe Experience Cloud and concentrates on:
Core Features:
- Web analytics with a focus on digital marketing.
- Data capture from multiple sources.
- Real-time reporting.
- Simplified tag management.
- Integration with other Adobe Experience Cloud products.
Tableau Vs. Adobe Analytics: Which is Better?
Data Integration and Management
Data Sources
The objective of Tableau is to act as a single place to connect data from more than 100 native applications, embedded SQL databases, excel documents, and online sources, including Salesforce and API integration.
This flexibility enables firms to integrate and analyze multiple datasets for a holistic understanding of business operations. For example, an eCommerce firm using Magento can see sales analytics, customer trends, and even supply chain values in one location.
On the other hand, Adobe Analytics specializes in capturing web and marketing data that broadly looks at the details of activity occurring within the digital channels. While this is key to targeted digital advertising campaigns, such a focus has its limitations in other uses, such as assessing the overall efficiency of the supply chain management or the portion of general sales generated by online traffic.
Data Collection Methods
Tableau depends on other data sources, enabling the firms to visualize historical, operational, and other data sources. On the other hand, Adobe Analytics is good at collecting granular data in real-time from web and app platforms, such as clicks, page hits/views, and user journeys.
Businesses with complex ecosystems with eCommerce, logistics, and customer service would better suit Tableau. At the same time, Adobe Analytics is best for marketers concerned with general user behavior across digital platforms.
Visualization Capabilities
Customization and Flexibility
The visualization engine of Tableau is very powerful, featuring hundreds of chart types, geospatial mapping, and many analytical tools. Users have the power to drag and drop fields to create different dashboards. This adjustment enables users not trained in programming to carry out many functions without relying on advanced coding languages.
Moreover, Adobe Analytics has decent dashboards, but it primarily focuses on already-defined templates and reports meant for marketers. A major limitation, however, is the lack of deep customization, which is essential for most corporations attempting to derive integrated insights.
User Interface and Usability
Tableau enables users to manage the data better with tools like “Show Me,” which indicates the most suitable visualization for the data set. For companies trying to industrialize analytics, Tableau is easy to use and customize, which helps build a data culture within an organization.
This is especially important for Magento users who want a cross-functional approach between the sales, marketing, and operations teams.
In contrast, Adobe Analytics has a steeper learning curve because it assumes familiarity with the Adobe Experience Cloud ecosystem, which is difficult for non-specialists.
Get a custom Tableau dashboard for your Magento store
Real-Time Analytics and Reporting
Speed and Performance
Tableau’s data engine, called Hyper, enhances the speed of analytics and makes the analysis almost real-time despite handling large data sets. For instance, an Ecommerce development company that uses Tableau can analyse sales of different products on Magento and even has the capability to determine the rate of customer loss during busy times.
Adobe Analytics enables you to receive real-time reports, but the range of the information provided concentrates mostly on the tracking of apps and websites. It performs exceptionally well for real-time tracking of digital campaigns but struggles with broader, business-wide reporting needs.
Real-Time Data Access
Tableau’s ability to refresh dashboards instantly gives businesses a live pulse on their operations. This is especially important for eCommerce businesses that want to gain immediate feedback to manage stock levels, reduce cart abandonment or tweak marketing efforts in real time.
Adobe Analytics has a strong use case for monitoring how users behave in real time. But Tableau has a wider scope that spans beyond marketing.
Key Limitations of Adobe Analytics
- Steep Learning Curve: It requires time to get comfortable utilising Adobe Analytics.
- High Cost: The pricing model is oftentimes a deterrent to small-scale businesses.
- Time-Consuming Setup: A good deal of time and technical knowledge goes into the integration of Adobe Analytics.
- Data Limitations: Cross-market analysis is difficult, especially with very large data sets and lacks depth.
Advantages of Tableau for Comprehensive Business Insights
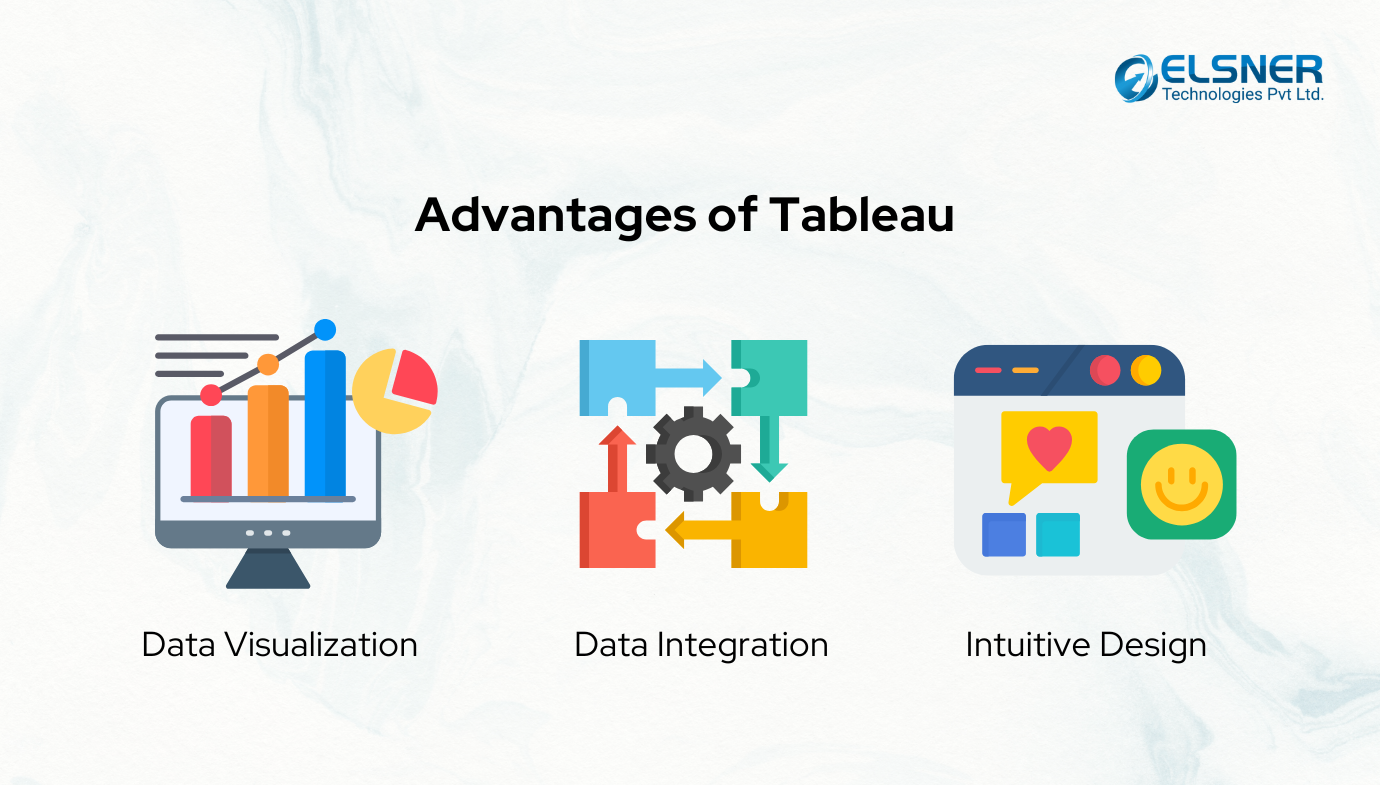
Superior Data Visualization
- Diverse Visualization Options: Tableau supports several visualization types, including heatmaps, geospatial charts, and trend analyses.
- Interactive Dashboards: Through the use of interactive dashboards, users can explore their data better and become aware of patterns and trends.
Integration Capabilities
- Types of Sources for Data: Tableau can function with multiple databases, Cloud, and APIs, making it suitable for eCommerces platforms like Magento.
- Third-Party Tools: Tableau also works well with third party tools making it more versatile.
User-Friendly Interface
- Accessibility for Non-Technical Users: From the non-technical users’ perspective, the interface of the tableau is quite appealing in terms of graphics and is easy to work with.
- Collaboration Features: Dashboards can be shared and combined with role-based permissions to facilitate group work and joint decision-making.
Scalability and Performance
- Handling Large Datasets: It is highly efficient and only takes a matter of seconds to deal with large amounts of information.
- Cloud and On-Premises Deployment: Tableau’s flexibility caters to businesses of all sizes and industries.
Simplify data-driven decision-making.
Get your sales, customers, POS, Accounting & inventory reports all in one place.
Real-World Use Cases of Tableau for Magento Stores
Sales Insights
Tableau consolidates sales data from Magento, POS systems, and accounting software. It gives store owners a unified view of revenue trends, average order values, and customer segments.
Customer Analysis
Most suitable customer segments are identified by AI-based data representation in Tableau, which can also make forecasts regarding the customers’ next purchases, thus enabling directed marketing strategies for enhanced retention.
Inventory Management
As a geospatial analytics tool, Tableau provides insights about the inventory at various warehouses and prevents overstock or out-of-stock scenarios.
Financial Reporting
The store owners can link any accounting applications to it in order to produce clear and precise reports about the financial movements incurred by costs and profit percentages.
Operational Efficiency
Track the times spent between orders and their processing, as well as optimize backend activities to improve the quality of service.
Increase customer retention and reduce operational inefficiency with Tableau data visualisation.
Conclusion
Tableau is like a sophisticated machinery that can aggregate data from various sources and then turn it all into visualizations that are easy to comprehend. Be it a small business or a big enterprise, Tableau is capable of dealing with it all. It grows along with you. And the best part? It’s made to be simple. No need to be a data scientist to know how it works.
For companies, particularly those who use Magento, this can be revolutionary– to be able to understand what makes people loyal, where resources can be best utilized and where costs can be reduced. If you’re ready to transform how you analyze data, explore Tableau and see how it can revolutionize your business.

About Author
Dipak Patil - Delivery Head & Partner Manager
Dipak is known for his ability to seamlessly manage and deliver top-notch projects. With a strong emphasis on quality and customer satisfaction, he has built a reputation for fostering strong client relationships. His leadership and dedication have been instrumental in guiding teams towards success, ensuring timely and effective delivery of services.

